
Die vier synthetischen Tests des AS SSD-Benchmarks ermitteln die sequentielle und zufällige Lese- und Schreibgeschwindigkeit unserer Testprobanden. Diese Tests werden ohne Nutzung des Betriebssystem-Caches durchgeführt. In den sequentiellen Tests misst das Programm wie lange es dauert, eine 1 GB große Datei zu lesen respektive zu schreiben. Im 4K-Test wird die Lese- und Schreibleistung bei zufällig ausgewählten 4K-Blöcken ermittelt. Der 4K-64-Thrd-Test entspricht dem 4K-Prozedere, nur dass in diesem Fall die Lese-und Schreiboperationen auf 64 Threads verteilt sind. Damit wird der typische Start eines Programms bzw. Prozesses simuliert.
Zuletzt wird noch die Zugriffszeit der SSD ermittelt, wobei der Zugriff beim Lesen über die gesamte Kapazität der SSD (Fullstroke) ermittelt wird. Der Schreibzugriffstest erfolgt mit einer 1 GB-Testdatei.
| read, Mittelwert | |
| Intel SSD 750 Series, 1.2 TB (PCIe 3.0 x4) | 2.275,06 |
| ZOTAC Sonix, 480 GB (PCIe 3.0 x4) | 2.182,49 |
| Kingston HyperX Predator, 480 GB (PCIe 2.0 x4) | 1.331,04 |
| Plextor M6e Black, 256 GB (PCIe 2.0 x2) | 677,99 |
| OCZ TR150, 480 GB | 526,71 |
| ZOTAC Premium SSD, 240 GB | 524,83 |
| Plextor M6V, 256 GB | 524,75 |
| Toshiba Q300, 240 GB | 524,67 |
| OCZ Trion 100, 960 GB | 524,10 |
| Kingston HyperX Savage SSD, 480 GB | 521,02 |
| Plextor M7V, 256 GB | 520,47 |
| Toshiba Q-Series Pro, 256 GB | 514,77 |
| Toshiba Q300 Pro, 256 GB | 514,61 |
| Toshiba Q300 Pro, 128 GB | 513,14 |
| OCZ Vector 180, 240 GB | 506,08 |
| Angaben in MB/sec (mehr ist besser) | |
| write, Mittelwert | |
| ZOTAC Sonix, 480 GB (PCIe 3.0 x4) | 1.287,07 |
| Intel SSD 750 Series, 1.2 TB (PCIe 3.0 x4) | 1.216,89 |
| Kingston HyperX Predator, 480 GB (PCIe 2.0 x4) | 614,05 |
| Plextor M6e Black, 256 GB (PCIe 2.0 x2) | 549,37 |
| OCZ TR150, 480 GB | 502,85 |
| Kingston HyperX Savage SSD, 480 GB | 502,74 |
| ZOTAC Premium SSD, 240 GB | 500,59 |
| OCZ Vector 180, 240 GB | 487,68 |
| Toshiba Q-Series Pro, 256 GB | 476,47 |
| Toshiba Q300, 240 GB | 474,55 |
| Toshiba Q300 Pro, 256 GB | 473,99 |
| Toshiba Q300 Pro, 128 GB | 469,73 |
| Plextor M7V, 256 GB | 439,55 |
| OCZ Trion 100, 960 GB | 385,69 |
| Plextor M6V, 256 GB | 344,49 |
| Angaben in MB/sec (mehr ist besser) | |
| read, Mittelwert | |
| ZOTAC Sonix, 480 GB (PCIe 3.0 x4) | 53,76 |
| ZOTAC Premium SSD, 240 GB | 53,51 |
| OCZ Vector 180, 240 GB | 47,91 |
| OCZ TR150, 480 GB | 46,26 |
| Kingston HyperX Savage SSD, 480 GB | 45,56 |
| OCZ Trion 100, 960 GB | 44,71 |
| Plextor M7V, 256 GB | 41,61 |
| Intel SSD 750 Series, 1.2 TB (PCIe 3.0 x4) | 41,34 |
| Kingston HyperX Predator, 480 GB (PCIe 2.0 x4) | 39,09 |
| Toshiba Q300, 240 GB | 37,35 |
| Plextor M6V, 256 GB | 36,85 |
| Plextor M6e Black, 256 GB (PCIe 2.0 x2) | 34,72 |
| Toshiba Q-Series Pro, 256 GB | 24,18 |
| Toshiba Q300 Pro, 256 GB | 24,05 |
| Toshiba Q300 Pro, 128 GB | 23,50 |
| Angaben in MB/sec (mehr ist besser) | |
| write, Mittelwert | |
| ZOTAC Sonix, 480 GB (PCIe 3.0 x4) | 187,10 |
| OCZ Vector 180, 240 GB | 138,09 |
| Plextor M6V, 256 GB | 123,85 |
| Toshiba Q300 Pro, 256 GB | 123,57 |
| Toshiba Q-Series Pro, 256 GB | 122,30 |
| Toshiba Q300 Pro, 128 GB | 121,95 |
| Kingston HyperX Savage SSD, 480 GB | 118,75 |
| ZOTAC Premium SSD, 240 GB | 114,90 |
| OCZ TR150, 480 GB | 111,89 |
| OCZ Trion 100, 960 GB | 110,63 |
| Plextor M7V, 256 GB | 101,83 |
| Kingston HyperX Predator, 480 GB (PCIe 2.0 x4) | 100,05 |
| Toshiba Q300, 240 GB | 98,22 |
| Plextor M6e Black, 256 GB (PCIe 2.0 x2) | 93,22 |
| Intel SSD 750 Series, 1.2 TB (PCIe 3.0 x4) | 90,65 |
| Angaben in MB/sec (mehr ist besser) | |
| read, Mittelwert | |
| Intel SSD 750 Series, 1.2 TB (PCIe 3.0 x4) | 1.417,09 |
| ZOTAC Sonix, 480 GB (PCIe 3.0 x4) | 856,96 |
| Kingston HyperX Predator, 480 GB (PCIe 2.0 x4) | 431,55 |
| Plextor M6e Black, 256 GB (PCIe 2.0 x2) | 389,62 |
| OCZ Vector 180, 240 GB | 378,73 |
| Kingston HyperX Savage SSD, 480 GB | 378,63 |
| OCZ Trion 100, 960 GB | 375,15 |
| ZOTAC Premium SSD, 240 GB | 373,88 |
| Toshiba Q300, 240 GB | 358,65 |
| Toshiba Q-Series Pro, 256 GB | 352,66 |
| Toshiba Q300 Pro, 128 GB | 351,84 |
| Toshiba Q300 Pro, 256 GB | 351,55 |
| Plextor M7V, 256 GB | 337,54 |
| Plextor M6V, 256 GB | 308,78 |
| OCZ TR150, 480 GB | 136,81 |
| Angaben in MB/sec (mehr ist besser) | |
| write, Mittelwert | |
| Intel SSD 750 Series, 1.2 TB (PCIe 3.0 x4) | 1.089,48 |
| ZOTAC Sonix, 480 GB (PCIe 3.0 x4) | 648,56 |
| Plextor M6e Black, 256 GB (PCIe 2.0 x2) | 332,33 |
| ZOTAC Premium SSD, 240 GB | 294,08 |
| OCZ TR150, 480 GB | 293,12 |
| OCZ Trion 100, 960 GB | 292,58 |
| OCZ Vector 180, 240 GB | 290,80 |
| Kingston HyperX Predator, 480 GB (PCIe 2.0 x4) | 284,03 |
| Kingston HyperX Savage SSD, 480 GB | 278,00 |
| Plextor M6V, 256 GB | 256,32 |
| Plextor M7V, 256 GB | 241,47 |
| Toshiba Q300 Pro, 256 GB | 213,69 |
| Toshiba Q-Series Pro, 256 GB | 212,69 |
| Toshiba Q300 Pro, 128 GB | 195,18 |
| Toshiba Q300, 240 GB | 97,42 |
| Angaben in MB/sec (mehr ist besser) | |
| read, Mittelwert | |
| Kingston HyperX Savage SSD, 480 GB | 0,03 |
| OCZ Trion 100, 960 GB | 0,03 |
| OCZ Vector 180, 240 GB | 0,03 |
| Plextor M6V, 256 GB | 0,03 |
| Plextor M6e Black, 256 GB (PCIe 2.0 x2) | 0,03 |
| Plextor M7V, 256 GB | 0,03 |
| Toshiba Q300, 240 GB | 0,03 |
| Intel SSD 750 Series, 1.2 TB (PCIe 3.0 x4) | 0,04 |
| ZOTAC Premium SSD, 240 GB | 0,04 |
| Kingston HyperX Predator, 480 GB (PCIe 2.0 x4) | 0,10 |
| Toshiba Q300 Pro, 256 GB | 0,14 |
| ZOTAC Sonix, 480 GB (PCIe 3.0 x4) | 0,15 |
| Toshiba Q-Series Pro, 256 GB | 0,20 |
| Toshiba Q300 Pro, 128 GB | 0,21 |
| OCZ TR150, 480 GB | 0,24 |
| Angaben in Millisekunden (weniger ist besser) | |
| write, Mittelwert | |
| Kingston HyperX Savage SSD, 480 GB | 0,03 |
| OCZ TR150, 480 GB | 0,03 |
| OCZ Trion 100, 960 GB | 0,03 |
| OCZ Vector 180, 240 GB | 0,03 |
| Toshiba Q-Series Pro, 256 GB | 0,03 |
| Toshiba Q300 Pro, 256 GB | 0,03 |
| ZOTAC Sonix, 480 GB (PCIe 3.0 x4) | 0,03 |
| Intel SSD 750 Series, 1.2 TB (PCIe 3.0 x4) | 0,04 |
| Plextor M6V, 256 GB | 0,04 |
| Plextor M6e Black, 256 GB (PCIe 2.0 x2) | 0,04 |
| Toshiba Q300 Pro, 128 GB | 0,04 |
| Plextor M7V, 256 GB | 0,05 |
| Kingston HyperX Predator, 480 GB (PCIe 2.0 x4) | 0,06 |
| ZOTAC Premium SSD, 240 GB | 0,14 |
| Toshiba Q300, 240 GB | 0,24 |
| Angaben in Millisekunden (weniger ist besser) | |
Wer sich mit digitalen Vermögenswerten beschäftigt, stößt früher oder später auf den Begriff der Hardware-Wallet. Gemeint ist ein physisches Gerät,...
Haben Sie das Problem, dass Ihre SD-Karte plötzlich nicht mehr erkannt wird? Dann sind Sie hier genau richtig. Wir zeigen...
Haben Sie wichtige Dateien von einer Festplatte verloren und wissen nicht, welche Datenrettungssoftware sich lohnt? Kostenlose und kostenpflichtige Programme sehen...
Wer sich für Technik begeistert, baut sein Setup gern selbst zusammen, Stück für Stück, Komponente für Komponente. Beim Heimkino oder...
Monatelange Planung, intensive Entwicklung, Tests und schließlich der große Moment: Die neue Website, die Unternehmenssoftware oder die digitale Plattform geht...
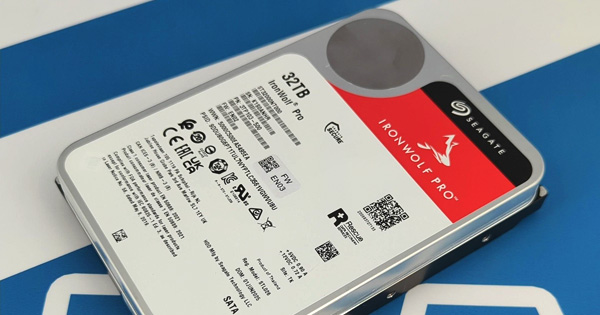
Die Familie der IronWolf Pro Festplatten von Hersteller Seagate adressiert vor allem NAS-Systeme im Profi-Segment. Wir haben uns das aktuelle Flaggschiff der CMR-Plattform mit satten 32 TB im Praxistest zur Brust genommen.
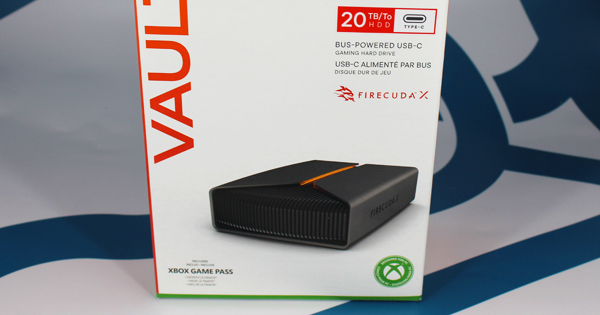
Mit der FireCuda X Vault präsentiert Seagate eine neue externe Festplatte, die vollständig über USB-C versorgt wird und bis zu satte 20 TB bietet. LED-Beleuchtung und ein passendes Toolkit runden das Gesamtpaket ab.
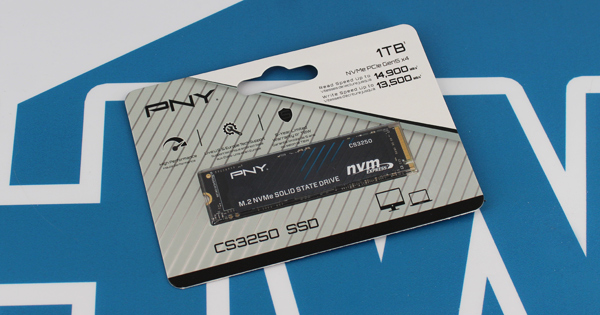
PNY bietet mit der CS3250 eine Familie von PCIe Gen5 SSDs an, die mit Speicherkapazitäten von bis zu 4 TB erhältlich sind. Die Drives erreichen bis zu 14.900 MB/s lesend. Wir haben das 1-TB-Modell getestet.