
Die Anvil's Storage Utilities sind kostenlos erhältlich und eignen sich sowohl für Benchmarks auf modernen SSDs als auch auf herkömmlichen magnetischen Speichern (HDDs). Die Freeware misst nicht nur die Lese- und Schreibtransferraten in bis zu sechs verschiedenen Clustergrößen, sondern auch die Anzahl der Ein- und Ausgabebefehle, die das Laufwerk pro Sekunde abarbeiten kann (IOPS). Für unsere Tests haben wir die sequentiellen Datenraten sowie IOPS ermittelt. Zudem mussten die Testprobanden bei kleineren 4K-Blöcken und bei erweiterter Anfragetiefe (QD16) ihr Können unter Beweis stellen.
| Transferrate, Lesen, Mittelwert | |
| Intel SSD 750 Series, 1.2 TB (PCIe 3.0 x4) | 2.151,26 |
| Kingston HyperX Predator, 480 GB (PCIe 2.0 x4) | 1.287,24 |
| Plextor M6e Black, 256 GB (PCIe 2.0 x2) | 721,13 |
| OCZ TR150, 480 GB | 531,53 |
| Plextor M6V, 256 GB | 529,34 |
| OCZ Trion 100, 960 GB | 527,29 |
| OCZ Vector 180, 240 GB | 527,21 |
| ZOTAC Premium SSD, 240 GB | 527,16 |
| Plextor M7V, 256 GB | 527,16 |
| Toshiba Q300, 240 GB | 525,13 |
| Kingston HyperX Savage SSD, 480 GB | 525,13 |
| Toshiba Q300 Pro, 256 GB | 520,99 |
| Toshiba Q300 Pro, 128 GB | 520,99 |
| Toshiba Q-Series Pro, 256 GB | 520,99 |
| Angaben in MB/sec (mehr ist besser) | |
| Transferrate, Schreiben, Mittelwert | |
| Intel SSD 750 Series, 1.2 TB (PCIe 3.0 x4) | 1.216,15 |
| Kingston HyperX Predator, 480 GB (PCIe 2.0 x4) | 585,81 |
| Plextor M6e Black, 256 GB (PCIe 2.0 x2) | 551,72 |
| Kingston HyperX Savage SSD, 480 GB | 500,98 |
| OCZ TR150, 480 GB | 497,33 |
| ZOTAC Premium SSD, 240 GB | 497,09 |
| Plextor M7V, 256 GB | 489,95 |
| OCZ Vector 180, 240 GB | 478,95 |
| Toshiba Q-Series Pro, 256 GB | 472,11 |
| Toshiba Q300 Pro, 256 GB | 465,45 |
| Toshiba Q300 Pro, 128 GB | 465,45 |
| OCZ Trion 100, 960 GB | 449,71 |
| Plextor M6V, 256 GB | 341,90 |
| Toshiba Q300, 240 GB | 154,08 |
| Angaben in MB/sec (mehr ist besser) | |
| Zugriffe, Lesen, Mittelwert | |
| Intel SSD 750 Series, 1.2 TB (PCIe 3.0 x4) | 537 |
| Kingston HyperX Predator, 480 GB (PCIe 2.0 x4) | 322 |
| Plextor M6e Black, 256 GB (PCIe 2.0 x2) | 180 |
| OCZ TR150, 480 GB | 133 |
| ZOTAC Premium SSD, 240 GB | 132 |
| Plextor M6V, 256 GB | 132 |
| OCZ Trion 100, 960 GB | 132 |
| Plextor M7V, 256 GB | 132 |
| Toshiba Q300, 240 GB | 131 |
| Kingston HyperX Savage SSD, 480 GB | 131 |
| Toshiba Q300 Pro, 256 GB | 130 |
| Toshiba Q300 Pro, 128 GB | 130 |
| Toshiba Q-Series Pro, 256 GB | 130 |
| OCZ Vector 180, 240 GB | 124 |
| Angaben in IOPS (mehr ist besser) | |
| Zugriffe, Schreiben, Mittelwert | |
| Intel SSD 750 Series, 1.2 TB (PCIe 3.0 x4) | 304 |
| Kingston HyperX Predator, 480 GB (PCIe 2.0 x4) | 147 |
| Plextor M6e Black, 256 GB (PCIe 2.0 x2) | 137 |
| Kingston HyperX Savage SSD, 480 GB | 125 |
| ZOTAC Premium SSD, 240 GB | 124 |
| OCZ TR150, 480 GB | 124 |
| Plextor M7V, 256 GB | 122 |
| OCZ Vector 180, 240 GB | 119 |
| Toshiba Q-Series Pro, 256 GB | 118 |
| Toshiba Q300 Pro, 256 GB | 116 |
| Toshiba Q300 Pro, 128 GB | 116 |
| OCZ Trion 100, 960 GB | 112 |
| Plextor M6V, 256 GB | 86 |
| Toshiba Q300, 240 GB | 38 |
| Angaben in IOPS (mehr ist besser) | |
| Transferrate, Lesen, Mittelwert | |
| Intel SSD 750 Series, 1.2 TB (PCIe 3.0 x4) | 42,96 |
| Plextor M7V, 256 GB | 42,67 |
| ZOTAC Premium SSD, 240 GB | 40,26 |
| OCZ Vector 180, 240 GB | 39,48 |
| Kingston HyperX Predator, 480 GB (PCIe 2.0 x4) | 38,54 |
| Plextor M6V, 256 GB | 38,01 |
| Plextor M6e Black, 256 GB (PCIe 2.0 x2) | 35,68 |
| Kingston HyperX Savage SSD, 480 GB | 34,55 |
| OCZ TR150, 480 GB | 33,89 |
| Toshiba Q300, 240 GB | 33,17 |
| OCZ Trion 100, 960 GB | 33,01 |
| Toshiba Q-Series Pro, 256 GB | 24,89 |
| Toshiba Q300 Pro, 256 GB | 24,84 |
| Toshiba Q300 Pro, 128 GB | 24,05 |
| Angaben in MB/sec (mehr ist besser) | |
| Transferrate, Schreiben, Mittelwert | |
| OCZ Vector 180, 240 GB | 147,38 |
| Toshiba Q300 Pro, 256 GB | 133,97 |
| Plextor M6V, 256 GB | 133,37 |
| Kingston HyperX Savage SSD, 480 GB | 131,42 |
| Toshiba Q300 Pro, 128 GB | 130,71 |
| Toshiba Q-Series Pro, 256 GB | 129,64 |
| ZOTAC Premium SSD, 240 GB | 122,54 |
| OCZ Trion 100, 960 GB | 121,91 |
| OCZ TR150, 480 GB | 114,65 |
| Kingston HyperX Predator, 480 GB (PCIe 2.0 x4) | 108,65 |
| Plextor M6e Black, 256 GB (PCIe 2.0 x2) | 101,46 |
| Plextor M7V, 256 GB | 98,37 |
| Intel SSD 750 Series, 1.2 TB (PCIe 3.0 x4) | 95,37 |
| Toshiba Q300, 240 GB | 87,38 |
| Angaben in MB/sec (mehr ist besser) | |
| Zugriffe, Lesen, Mittelwert | |
| Intel SSD 750 Series, 1.2 TB (PCIe 3.0 x4) | 10.997 |
| Plextor M7V, 256 GB | 10.924 |
| ZOTAC Premium SSD, 240 GB | 10.305 |
| Kingston HyperX Predator, 480 GB (PCIe 2.0 x4) | 9.866 |
| Plextor M6V, 256 GB | 9.731 |
| OCZ Vector 180, 240 GB | 9.545 |
| Plextor M6e Black, 256 GB (PCIe 2.0 x2) | 9.134 |
| Kingston HyperX Savage SSD, 480 GB | 8.844 |
| OCZ TR150, 480 GB | 8.674 |
| Toshiba Q300, 240 GB | 8.492 |
| OCZ Trion 100, 960 GB | 8.451 |
| Toshiba Q-Series Pro, 256 GB | 6.373 |
| Toshiba Q300 Pro, 256 GB | 6.359 |
| Toshiba Q300 Pro, 128 GB | 6.158 |
| Angaben in IOPS (mehr ist besser) | |
| Zugriffe, Schreiben, Mittelwert | |
| OCZ Vector 180, 240 GB | 37.728 |
| Toshiba Q300 Pro, 256 GB | 34.296 |
| Plextor M6V, 256 GB | 34.143 |
| Kingston HyperX Savage SSD, 480 GB | 33.642 |
| Toshiba Q300 Pro, 128 GB | 33.461 |
| Toshiba Q-Series Pro, 256 GB | 33.188 |
| ZOTAC Premium SSD, 240 GB | 31.369 |
| OCZ Trion 100, 960 GB | 31.208 |
| OCZ TR150, 480 GB | 29.350 |
| Kingston HyperX Predator, 480 GB (PCIe 2.0 x4) | 27.815 |
| Plextor M6e Black, 256 GB (PCIe 2.0 x2) | 25.973 |
| Plextor M7V, 256 GB | 25.182 |
| Intel SSD 750 Series, 1.2 TB (PCIe 3.0 x4) | 24.415 |
| Toshiba Q300, 240 GB | 22.368 |
| Angaben in IOPS (mehr ist besser) | |
| Transferrate, Lesen, Mittelwert | |
| Intel SSD 750 Series, 1.2 TB (PCIe 3.0 x4) | 577,00 |
| OCZ Vector 180, 240 GB | 349,81 |
| ZOTAC Premium SSD, 240 GB | 344,38 |
| Plextor M6e Black, 256 GB (PCIe 2.0 x2) | 314,18 |
| Kingston HyperX Predator, 480 GB (PCIe 2.0 x4) | 307,47 |
| Toshiba Q300 Pro, 256 GB | 302,62 |
| Toshiba Q-Series Pro, 256 GB | 299,14 |
| Kingston HyperX Savage SSD, 480 GB | 298,61 |
| OCZ TR150, 480 GB | 298,27 |
| Toshiba Q300, 240 GB | 291,25 |
| OCZ Trion 100, 960 GB | 289,91 |
| Plextor M7V, 256 GB | 283,11 |
| Toshiba Q300 Pro, 128 GB | 277,86 |
| Plextor M6V, 256 GB | 272,96 |
| Angaben in MB/sec (mehr ist besser) | |
| Transferrate, Schreiben, Mittelwert | |
| Intel SSD 750 Series, 1.2 TB (PCIe 3.0 x4) | 1.131,36 |
| Kingston HyperX Savage SSD, 480 GB | 343,26 |
| OCZ Vector 180, 240 GB | 342,63 |
| Plextor M6e Black, 256 GB (PCIe 2.0 x2) | 331,44 |
| ZOTAC Premium SSD, 240 GB | 326,00 |
| Plextor M7V, 256 GB | 320,23 |
| Kingston HyperX Predator, 480 GB (PCIe 2.0 x4) | 318,83 |
| OCZ TR150, 480 GB | 297,01 |
| Plextor M6V, 256 GB | 287,03 |
| OCZ Trion 100, 960 GB | 266,39 |
| Toshiba Q300 Pro, 256 GB | 240,34 |
| Toshiba Q-Series Pro, 256 GB | 236,62 |
| Toshiba Q300 Pro, 128 GB | 206,48 |
| Toshiba Q300, 240 GB | 140,54 |
| Angaben in MB/sec (mehr ist besser) | |
| Zugriffe, Lesen, Mittelwert | |
| Intel SSD 750 Series, 1.2 TB (PCIe 3.0 x4) | 147.711 |
| ZOTAC Premium SSD, 240 GB | 88.161 |
| OCZ Vector 180, 240 GB | 83.950 |
| Plextor M6e Black, 256 GB (PCIe 2.0 x2) | 80.431 |
| Kingston HyperX Predator, 480 GB (PCIe 2.0 x4) | 78.711 |
| Toshiba Q300 Pro, 256 GB | 77.471 |
| Toshiba Q-Series Pro, 256 GB | 76.580 |
| Kingston HyperX Savage SSD, 480 GB | 76.444 |
| OCZ TR150, 480 GB | 76.356 |
| Toshiba Q300, 240 GB | 74.559 |
| OCZ Trion 100, 960 GB | 74.217 |
| Plextor M7V, 256 GB | 72.475 |
| Toshiba Q300 Pro, 128 GB | 71.131 |
| Plextor M6V, 256 GB | 69.878 |
| Angaben in IOPS (mehr ist besser) | |
| Zugriffe, Schreiben, Mittelwert | |
| Intel SSD 750 Series, 1.2 TB (PCIe 3.0 x4) | 289.628 |
| Kingston HyperX Savage SSD, 480 GB | 87.874 |
| OCZ Vector 180, 240 GB | 87.712 |
| Plextor M6e Black, 256 GB (PCIe 2.0 x2) | 84.848 |
| ZOTAC Premium SSD, 240 GB | 83.457 |
| Plextor M7V, 256 GB | 81.980 |
| Kingston HyperX Predator, 480 GB (PCIe 2.0 x4) | 81.621 |
| OCZ TR150, 480 GB | 76.035 |
| Plextor M6V, 256 GB | 73.480 |
| OCZ Trion 100, 960 GB | 68.195 |
| Toshiba Q300 Pro, 256 GB | 61.527 |
| Toshiba Q-Series Pro, 256 GB | 60.575 |
| Toshiba Q300 Pro, 128 GB | 52.859 |
| Toshiba Q300, 240 GB | 35.979 |
| Angaben in IOPS (mehr ist besser) | |
Mit dem TEG-S708 erweitert TRENDnet sein Portfolio um einen unmanaged Multi-Gigabit-Switch mit acht RJ45-Ports und einer maximalen Übertragungsrate von 10...
Der Markt für Mähroboter hat sich in den vergangenen Jahren rasant weiterentwickelt. Während früher Begrenzungskabel zur Grundausstattung gehörten, setzen moderne...
Die Frage ist längst keine theoretische mehr: Wer in der Produktion auf vernetzte Maschinen, Echtzeitdaten und automatisierte Prozesse setzt, muss...
Persönliche Informationen sind längst zu einer digitalen Währung geworden. Jede Online-Aktivität hinterlässt Spuren, die Kriminelle anlocken. Phishing, Ransomware und Zero-Day-Exploits...
Samsung erweitert sein SSD-Portfolio um die neue SSD 990. Die NVMe-SSD mit PCIe-4.0-Schnittstelle richtet sich an Gamer, Content Creator und...
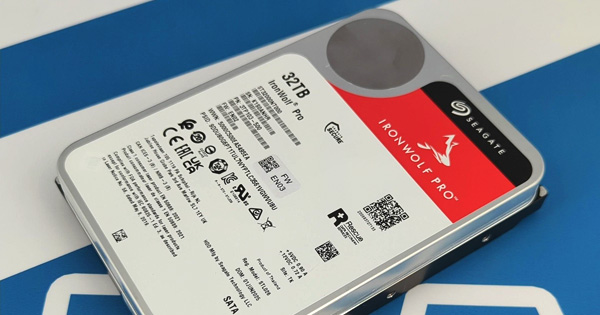
Die Familie der IronWolf Pro Festplatten von Hersteller Seagate adressiert vor allem NAS-Systeme im Profi-Segment. Wir haben uns das aktuelle Flaggschiff der CMR-Plattform mit satten 32 TB im Praxistest zur Brust genommen.
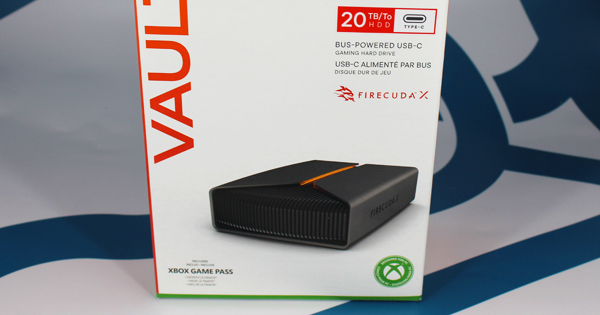
Mit der FireCuda X Vault präsentiert Seagate eine neue externe Festplatte, die vollständig über USB-C versorgt wird und bis zu satte 20 TB bietet. LED-Beleuchtung und ein passendes Toolkit runden das Gesamtpaket ab.
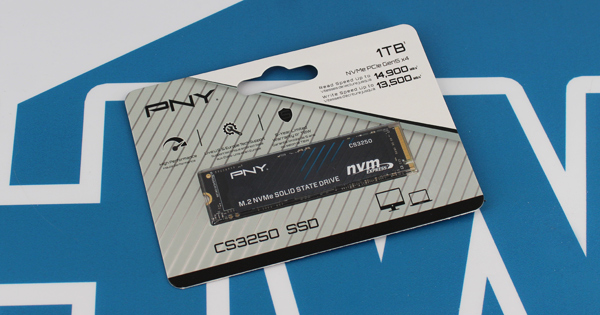
PNY bietet mit der CS3250 eine Familie von PCIe Gen5 SSDs an, die mit Speicherkapazitäten von bis zu 4 TB erhältlich sind. Die Drives erreichen bis zu 14.900 MB/s lesend. Wir haben das 1-TB-Modell getestet.